-
1 bar chart
-
2 bar chart
English-German dictionary of Electrical Engineering and Electronics > bar chart
-
3 bar chart
bar chart noun гистограмма -
4 bar chart
- bar chart
- n
Англо-русский строительный словарь. — М.: Русский Язык. С.Н.Корчемкина, С.К.Кашкина, С.В.Курбатова. 1995.
-
5 bar chart
-
6 bar chart
bar chart[b'a: tʃa:t] n gráfico para estatística. -
7 bar chart
bar chart[´ba:¸tʃa:t] n стълбова диаграма. -
8 bar chart
Histogramm nt, Säulendiagramm nt, Balkendiagramm nt -
9 bar chart
bar chart GEN, STAT Balkendiagramm n, Säulendiagramm n, Säulenschaubild n, Stabdiagramm n (statistics) -
10 bar chart
English-German dictionary of Architecture and Construction > bar chart
-
11 bar chart
-
12 bar chart
-
13 bar chart
гистограмма
График, состоящий из вертикальных или горизонтальных полос, высота или ширина которых пропорциональны значениям данных.
[ http://www.morepc.ru/dict/]
гистограмма
столбиковая диаграмма
-
[Лугинский Я. Н. и др. Англо-русский словарь по электротехнике и электроэнергетике. 2-е издание - М.: РУССО, 1995 - 616 с.]Тематики
Синонимы
EN
светодиодная шкала
линейный индикатор
-
[Интент]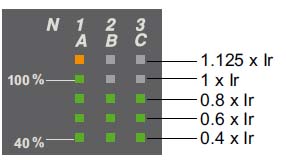
Рис. Schneider ElectricПараллельные тексты EN-RU
A bargraph on the front of the control unit continuously displays the currents measured on phases 1, 2 and 3 as a percentage of the long-time current setting Ir.
[Schneider Electric]Светодиодная шкала, расположенная на лицевой панели расцепителя, непрерывно отображает измеренные токи в фазах 1, 2 и 3, в процентах от уставки тока Ir защиты с длительной задержкой срабатывания.
[Перевод Интент]
Тематики
Синонимы
EN
Англо-русский словарь нормативно-технической терминологии > bar chart
-
14 bar chart
nounStabdiagramm, das* * *n Histogramm nt, Säulendiagramm nt, Balkendiagramm nt* * ** * *nounStabdiagramm, das* * *n.Balkendiagramm n. -
15 bar chart
Gen Mgtthe presentation of data in the form of a graph, using blocks or bars of color or shading. A bar chart is especially useful for showing the impact of one factor against another, for example, income over time, or customer calls against sales. -
16 bar chart
(=bar graph)وزن سنج، وزن نگار، دستگاه ثبت وزن -
17 bar chart
= bar graphFrench\ \ diagramme à tuyaux d'orgue; diagramme à colonnes; diagramme de barres; diagramme à bâtons; diagramme à tuyaux d'orgue; histogrammeGerman\ \ Stabdiagramm; SäulendiagrammDutch\ \ staafdiagramItalian\ \ grafico a barre; grafico a colonne; diagramma a barre; diagramma a colonneSpanish\ \ gráfico de barras; diagrama de barrasCatalan\ \ diagrama de barresPortuguese\ \ gráfico de barras; diagrama de barrasRomanian\ \ -Danish\ \ pindediagramNorwegian\ \ stolpediagramSwedish\ \ stapeldiagramGreek\ \ ραβδόγραμμαFinnish\ \ pylväskuvioHungarian\ \ oszlopdiagramTurkish\ \ çubuk grafiğiEstonian\ \ tulpdiagrammLithuanian\ \ histogramaSlovenian\ \ prikaz s stolpciPolish\ \ wykres słupkowy; karta słupkowa; histogramRussian\ \ гистограммаUkrainian\ \ гістограмаSerbian\ \ тракасти дијаграмIcelandic\ \ stöplarit; súluritEuskara\ \ barra-diagramaFarsi\ \ nemoodare mile-eePersian-Farsi\ \ نمودار ميلهايArabic\ \ خريطة الاعمدة ( لوحة الاعمدة)؛ لوحة المراقبةAfrikaans\ \ staafkaartChinese\ \ 条 星 图Korean\ \ 막대그림표, 막대도표 -
18 bar chart
гистограмма, столбчатая диаграммаграфическое представление данных в виде столбцов одинаковой ширины - при этом значение зависимой переменной отображается высотой каждого столбцаАнгло-русский толковый словарь терминов и сокращений по ВТ, Интернету и программированию. > bar chart
-
19 bar chart
столбиковая диаграмма; гистограммаСинонимический ряд:chart (noun) chart; design; diagram; flow chart; graph; linear representation; picture; pie chart; plot -
20 bar chart
1) т. вер., стат. = histogram2) бирж. гистограмма, столбиковый график (графическое представление движения цен за промежуток времени; максимум и минимум цен являются верхом и низом вертикальной линии, закрытие обозначается короткой горизонтальной чертой, расположенной справа на вертикальной линии, открытие отмечается короткой горизонтальной чертой, расположенной слева от вертикальной линии, цена отмечается на вертикальной оси, время — на горизонтальной оси)Syn:See:
* * *
график на основе полосок (столбиков) одинаковой ширины и разной высоты в зависимости от отражаемых чисел; позволяет облегчить сопоставления (напр., разновидность графика, используемого в техническом анализе, в котором еженедельная (ежечасная, ежедневная) амплитуда колебаний цены (курса) отмечается вертикальной линией c фиксацией перпендикулярными черточками уровня на момент закрытия биржи (рынка)); см. point-and-figure chart.* * *план-график; столбиковая диаграмма; гистограмма;. . Словарь экономических терминов .
См. также в других словарях:
bar chart — bar charts N COUNT A bar chart is a graph which uses parallel rectangular shapes to represent changes in the size, value, or rate of something or to compare the amount of something relating to a number of different countries or groups. [mainly… … English dictionary
bar chart — n. BAR GRAPH * * * … Universalium
bar chart — also bar graph n a picture of boxes of different heights, in which each box represents a different amount or quantity … Dictionary of contemporary English
bar chart — bar′ chart n. sta bar graph … From formal English to slang
bar chart — (also bar graph) ► NOUN ▪ a diagram in which different quantities are represented by rectangles of varying height … English terms dictionary
bar chart — n. BAR GRAPH … English World dictionary
Bar Chart — [engl.], Balkendiagramm … Universal-Lexikon
bar chart — noun a chart with bars whose lengths are proportional to quantities • Syn: ↑bar graph • Hypernyms: ↑chart • Hyponyms: ↑histogram * * * noun Etymology: bar ( … Useful english dictionary
Bar chart — See also: Histogram Example of a bar chart, with Country as the discrete data set. A bar chart or bar graph is a chart with rectangular bars with lengths proportional to the values that they represent. The bars can be plotted vertically or… … Wikipedia
bar chart — A chart that graphs the high, low, and settlement prices for a specific trading session over a given period of time. Chicago Board of Trade glossary A graphic representation of price movement disclosing the high, low, close, and sometimes the… … Financial and business terms
Bar Chart — A style of chart used by some technical analysts, on which, as illustrated below, the top of the vertical line indicates the highest price a security traded at during the day, and the bottom represents the lowest price. The closing price is… … Investment dictionary